GossipCat Tutorials
Data Science Projects Basics
Project Management
Embarking on a new project is like setting off on an exciting journey, complete with challenges and triumphs. To ensure a smooth and successful voyage, meticulous planning is essential. GossipCat provides a project management companion – a Notion template designed to empower you from start to finish. This template combines three powerful tools into one organized space:
A high-level flowchart to guide your project’s pathways,
A detailed checklist to track tasks milestones, and
An interactive timeline to keep your progress in perspective.
File System Setup
The first step to start a data science project should always be to set up a development file system, no matter on the cloud or on your laptop. GossipCat provides a one-line command to set up a well-organized file system for data science projects.
python -m gossipcat.dev.FileSys
The interactive and immersive command-line interfaces are as follows. Just type down your project name, like battery in this tutorial. Then it will generate a file structure for your data science project and print out a file tree of it.
hi, there! please write down your machine learning project's name.
project's name: battery
project_battery/
    requirements.txt
    README.md
    .gitignore
    docs/
        READM.md
    log/
    model/
    test/
    data/
        tmp/
        train/
        test/
        result/
        raw/
    notebook/
    report/
    script/
        config.json
    deploy/
        deploy.sh
Note
requirements.txtincludes all packages you need in your project. We recommend you list not only package names but also their versions in the file. Besides, this serves you well if you develop your project on SageMaker, for you have to install all required packages every time you restart the Jupyter Notebook instance..gitignoreincludesdata/*by default, which is our best practice in data science projects with git. Generally, you don’t want to git your data.docs/READM.mdis inspired by How to ML Paper - A brief Guide. We highly recommend you to document your data science project in an organized way so that anyone, including yourself, can catch up your thoughts in the future.
Dockerfile Setup
We highly recommend you to use docker to deploy you project or data science application. If you already installed docker, run the following code:
docker init
Logging
Most data scientists spend little time logging in and may just print out the experiment in Jupyter Notebook. However, this can cause annoying troubles when it comes to a production environment or when data science experiments require a long period to generate experiment records. Therefore, logging is critical to a data science project.
Python Module Logging is one of the most underrated features. Two things (5&3) to take away from Logging:
5 levels of importance that logs can contain(debug, info, warning, error, critical);
3 components to configure a logger in Python (a logger, a formatter, and at least one handler).
GossipCat provides a function get_logger to make life easier.
import gossipcat as gc

log_name = 'battery'
log_file = '../log/batter.log'

logger = gc.get_logger(logName=log_name, logFile=log_file)

logger.debug('this is a debug')
logger.info('this is a test')
logger.warning('this is a warning')

logger.error('this is an error!')
logger.critial('this is critical!')
Data Science Experiment
Most problems in the industry are not crystal clear as data science or machine learning homework problems in school. Data scientists should work with other function teams closely to really understand the problem and try to figure out a practical way to solve it. AND it is not even necessary to be a data science or machine learning project –– a data scientist is a problem solver first and can solve it with data science when necessary.
Even within data science, there are plenty of methods and algorithms to solve problems, which really depend on the business needs and technique feasibility. Also, this is where creativity happens. A good data scientist should be familiar with commonly used methods and able to pick up new methods if necessary to adapt to the needs both from business and technique.

Leave the creative ones aside, GossipCat and this tutorial focus on commonly used methods, say classification and regression, to provide a quick start and to reduce repetitive work as much as possible.
Model Assumptions
All models, including machine learning (ML) models, are built on assumptions. These assumptions are integral to how models operate and make predictions or classifications. The assumptions in machine learning models are shaped by the data you use. The data you collect or obtain for training and testing machine learning models plays a significant role in defining the model’s behavior and the assumptions it operates under.
Before applying machine learning models to new or unseen data, it’s essential to check whether the data meets the assumptions that the model relies on. This process is often referred to as model validation or model evaluation.
Documenting and listing all assumptions in your model documentation and including them in a model card is a crucial practice in machine learning. Here are some common types of assumptions that you might document in your model documentation and model card:
Data distribution assumptions.
Feature engineering and selection assumptions.
Assumptions related to the model’s architecture and hyperparameters.
Assumptions about data quality and preprocessing.
Assumptions about class priors in classification tasks.
Assumptions regarding fairness and bias considerations.
By documenting these assumptions, you create a clear and comprehensive reference for your model, which aids in responsible AI deployment and ensures that users have a better understanding of the model’s strengths and limitations.
Experiment Design
We generally divide the experiments into three categories: physical experiments, production experiments, and data experiments. Traditional experiments like physics, chemistry, and biology are all physical experiments, which are the most effective ones but also can cost much money and time compared to data experiments. Besides, the most impactful and expensive experiment is the one on production and generally is conducted with A/B testing. The data experiments are based on the data we have, not the data generated by physical experiments or online productions.

Granularity
Data granularity is a measure of the level of detail in a data structure. It is not always clear in the industrial scenarios and therefore is critical to problem solving.
A temporal granularity is a partition of the timeline. Each element of the partition is called a granule, which can be used to provide information with a time qualification.
A spatial granularity is a partition of a space. A granule in the granularity represents a region of the partition. Each granule can be used to provide information with a spatial qualification.
A spatiotemporal granularity represents changes in time of a spatial granularity: it associates space to time and can be used to provide information with a spatiotemporal qualification.
In time-series data, for example, the granularity of measurement might be based on intervals of years, months, weeks, days, or hours. For ordering transactions, granularity might be at the purchase order level, or line item level, or detailed configuration level for customized parts.
Target
For supervised machine learning, it seems to be clear that you have labels (or target, dependent variables) in your data set. While the target definition does not always inherently exist. For example,
Price predicting: listing price or selling price?
Non-performing loans classification: A nonperforming loan (NPL) is a sum of borrowed money whose scheduled payments have not been made by the debtor for a period –– usually 90 or 180 days. So, 90 or 180? Any tolerance periods?
Other than the physical world, things are always defined by people and therefore can be very different from time to time and from scenario to scenario. Things are always changing in the physical world as well. Before talking about any concepts abstractly, define them concretely. This is a teamwork involving both business and technique teams.
Data scientists should always double-confirm with the business team about the target definition. Furthermore, data scientists should always be skeptical of the definition especially when the training results are too good to be true. Check if there is any data leakage in the definition.
Note
Data Leakage: Data leakage (or leakage) happens when your training data contains information about the target, but similar data will not be available when the model is used for prediction. This leads to high performance on the training set (and possibly even the validation data), but the model will perform poorly in production.
In other words, leakage causes a model to look accurate until you start making decisions with the model, and then the model becomes very inaccurate.
There are two main types of leakage: target leakage and train-test contamination.
Features
Features does not inherently exist for most data science projects, and that is why feature engineering is so critical in deciding the upper limit of the performance of the models. Like the target design we talked about above, feature design or feature engineering involves more collaborations with the business and tech sides.
Generally speaking, one should consider three major ways to do feature engineering:
Mathematics: transformations of features (e.g. \(log(x)\), \(\sqrt{x}\), \(x^2\), etc.), discretize continuous features, decompose features (e.g., categorical, date/time, etc.), and aggregate features into promising new features.
Exploratory Data Analysis: Just play with the data, and visualize data intuitively, without any model assumptions.
Domain Experts: Do research on the topics, go ask some domain experts.
When designing a feature, you should always keep in mind that a useful feature is the one that can distinguish positive samples from negative ones. For example, in the dog-cat classification, the feature – having a tail can never be a good feature to tell them apart, but the feature – the way they sound can serve as a useful one.
Time Window
Different than the dog-cat classification, most machine learning projects in business are related to time. We would like to predict or forecast something, of course in the future. So we should take the time into consideration when we design training datasets. Here comes the Time Window.
There are two major approaches: the sliding window approach and the expanding window approach. (Source: Uber Engineering )
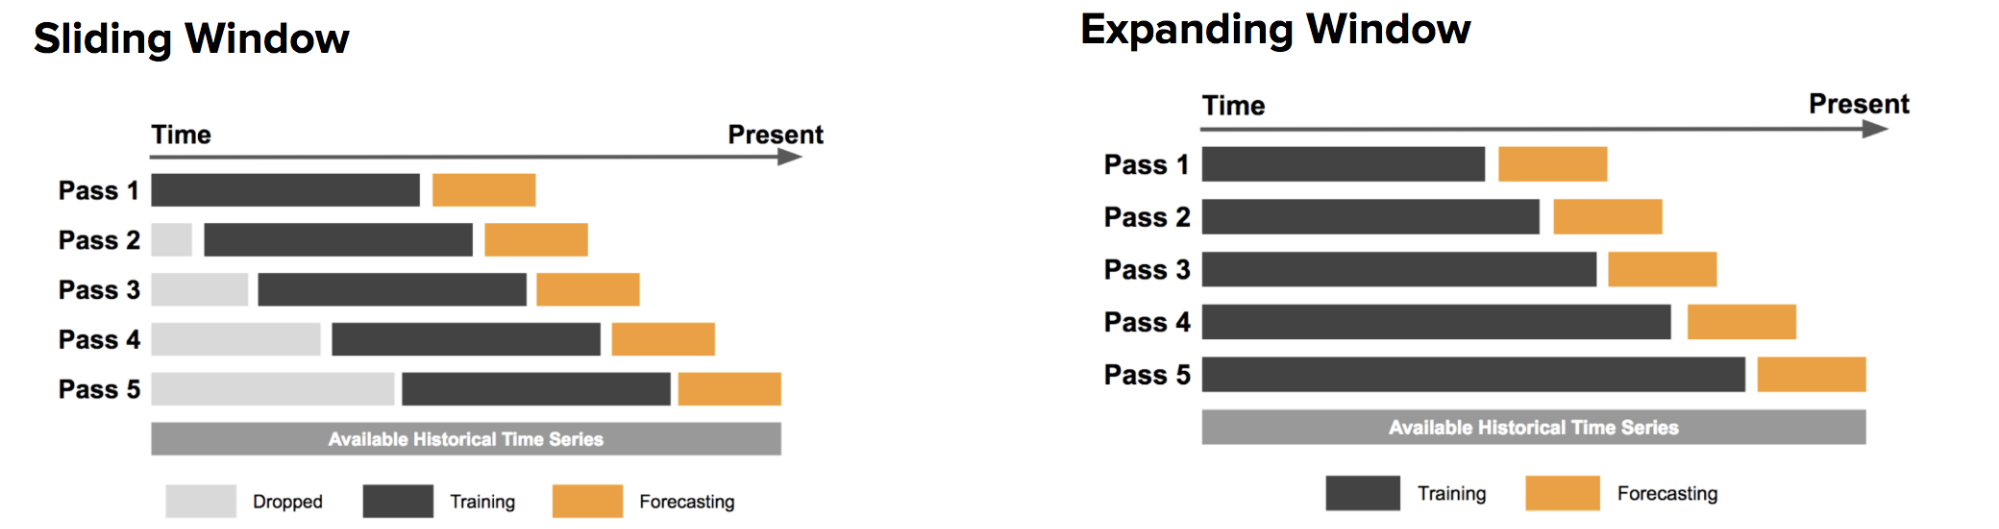
Sliding window: In the sliding window approach, one uses a fixed-size window, shown here in black, for training. Subsequently, the method is tested against the data shown in orange.
Expanding window: On the other hand, the expanding window approach uses more and more training data, while keeping the testing window size fixed. The latter approach is particularly useful if there is a limited amount of data to work with.
It is also possible, and often best, to marry the two methods: start with the expanding window method and, when the window grows sufficiently large, switch to the sliding window method.
Cross Validation
The Vanilla idea to test a model’s performance is to split the data into training and test sets, which can lead to a bais from the test set. So we have cross-validation, which gives a more accurate measure of model quality.

Modeling Design
Even the junior data scientists should be familiar with what we include in the Modeling Design since this is the most discussed part in school or any other courses about data science or machine learning. However, without the Experiment Design, we just talked about above, the Modeling Design is meaningless. You can never achieve your destination in the wrong direction.
Baseline
It is very important to have a baseline whenever you start a machine learning project, and the baseline is even not necessary to be a machine learning one.
Rule #1: Don’t be afraid to launch a product without machine learning.
Machine learning is cool, but it requires data. Theoretically, you can take data from a different problem and then tweak the model for a new product, but this will likely underperform basic heuristics. If you think that machine learning will give you a 100% boost, then a heuristic will get you 50% of the way there.
For instance, if you are ranking apps in an app marketplace, you could use the install rate or number of installs as heuristics. If you are detecting spam, filter out publishers that have sent spam before. Don’t be afraid to use human editing either. If you need to rank contacts, rank the most recently used highest (or even rank alphabetically). If machine learning is not absolutely required for your product, don’t use it until you have data.
The above Rule #1 is given by Goolge’s Rules of Machine Learning.
Only when you have a baseline, all your efforts can be compared then. Otherwise, you may probably spend much time talking how fancy your model is while nobody knows what value you actually can contribute.
Algorithm Comparison
When you open any machine learning introduction book, you will find a bunch of algorithms. Here comes the question: Which one is best for your project?
A model is a simplified version of the observations. The simplifications are meant to discard the superfluous details that are unlikely to generalize to new instances. To decide what data to discard and what data to keep, you must make assumptions. For example, a linear model makes the assumption that the data is fundamentally linear and that the distance between the instances and the straight line is just noise, which can safely be ignored.
In a famous 1996 paper, David Wolpert demonstrated that if you make absolutely no assumption about the data, then there is no reason to prefer one model over any other. This is called the No Free Lunch (NFL) theorem. For some datasets, the best model is a linear model, while for other datasets it is a neural network. There is no model that is a priori guaranteed to work better (hence the name of the theorem). The only way to know for sure which model is best is to evaluate them all. Since this is not possible, in practice you make some reasonable assumptions about the data and evaluate only a few reasonable models. For example, for simple tasks, you may evaluate linear models with various levels of regularization, and for a complex problems, you may evaluate various neural networks.[HOML]
Our best strategy is to explore many different models and shortlist the best ones.
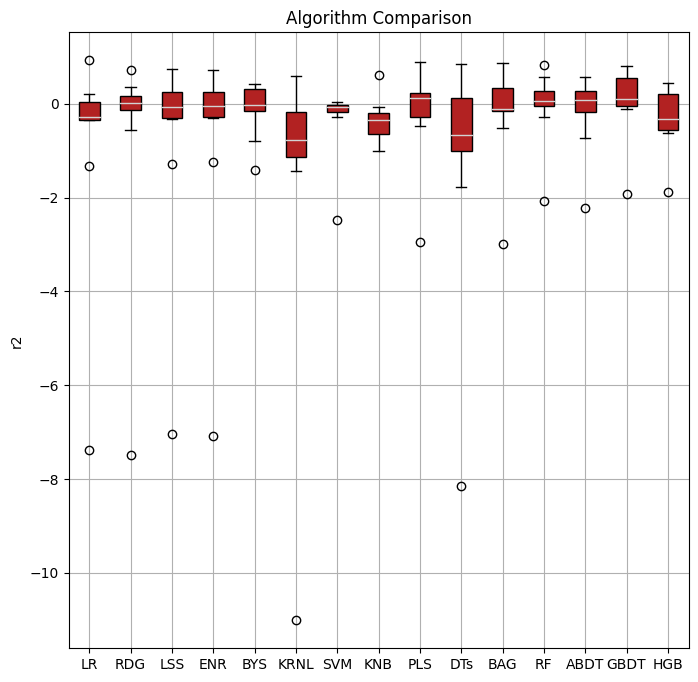
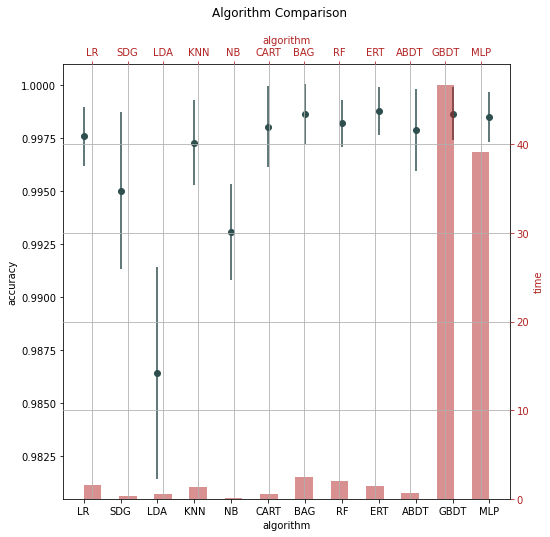
Here’s an example of a regression task.
import gossipcat as gc

com = gc.lab.Comparison(df=df[feature+[target]],
                        target=target,
                        features=feature,
                        metric='r2')

com.visualize()
com.visualize(time=True)
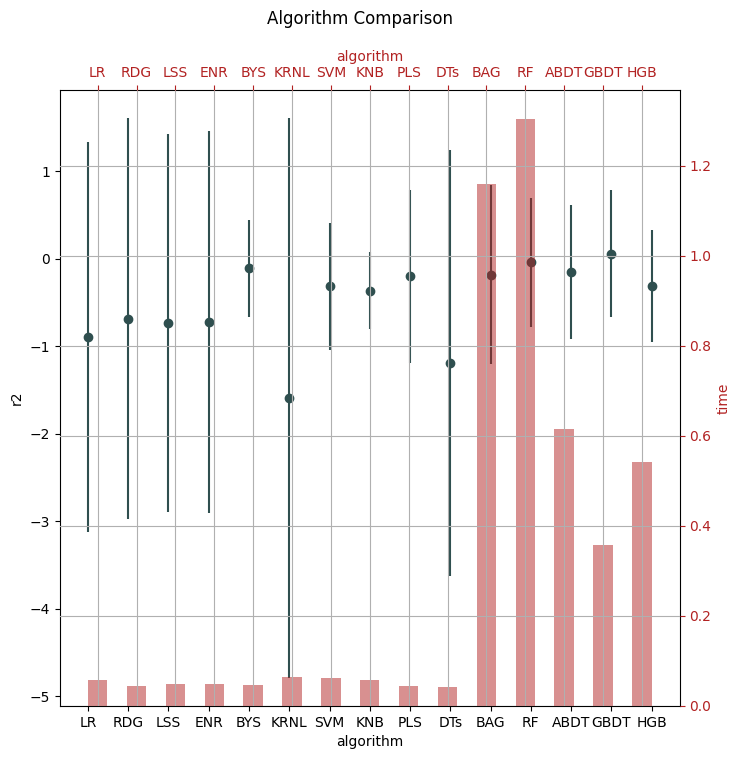
The algorithms included above can be found in scikit-learn.
Abbrev |
Algorithm |
|---|---|
LR |
LinearRegression |
RDG |
Ridge |
LSS |
Lasso |
ENR |
ElasticNet |
LAR |
Lars |
BYS |
BayesianRidge |
SDG |
SGDRegressor |
PAR |
PassiveAggressiveRegressor |
KRNL |
KernelRidge |
SVM |
SVR |
KNB |
KNeighborsRegressor |
GPR |
GaussianProcessRegressor |
PLS |
PLSRegression |
DTs |
DecisionTreeRegressor |
BAG |
BaggingRegressor |
RF |
RandomForestRegressor |
ABDT |
AdaBoostRegressor |
GBDT |
GradientBoostingRegressor |
HGB |
HistGradientBoostingRegressor |
The following is an example of a classification task.
com = gc.lab.Comparison(df=df[feature+[target]],
                        target=target,
                        features=feature,
                        metric='accuracy')

com.visualize()
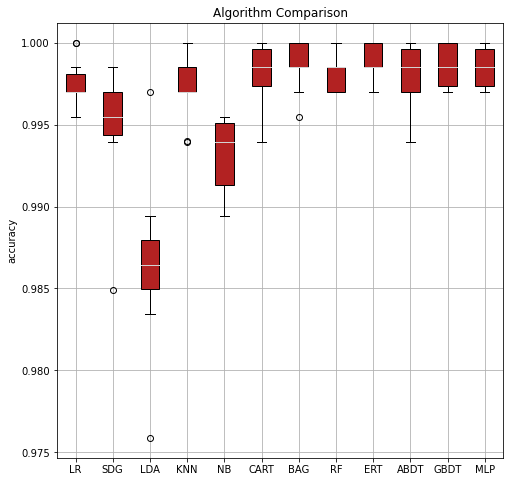
com.visualize(time=True)
Abbrev |
Algorithm |
|---|---|
LR |
LogisticRegression |
SDG |
SGDClassifier |
LDA |
LinearDiscriminantAnalysis |
KNN |
KNeighborsClassifier |
NB |
GaussianNB |
CART |
DecisionTreeClassifier |
BAG |
BaggingClassifier |
RF |
RandomForestClassifier |
ERT |
ExtraTreesClassifier |
ABDT |
AdaBoostClassifier |
GBDT |
GradientBoostingClassifier |
MLP |
MLPClassifier |
Note
It is clear that the ensembled tree-based models (Bagging, Random Forest, and Boosting) win in the above two examples. This is actually not a surprise to us.
Tree Based models (like Random Forests), have been much better than Deep Learning/Neural Networks when it comes to analyzing tabular data. Why do tree-based models still outperform deep learning on tabular data?
Reason 1: Neural Nets are biased to overly smooth solutions.
Reason 2: Uninformative features affect more MLP-like NNs.
Reason 3: NNs are invariant to rotation. Actual Data is not.
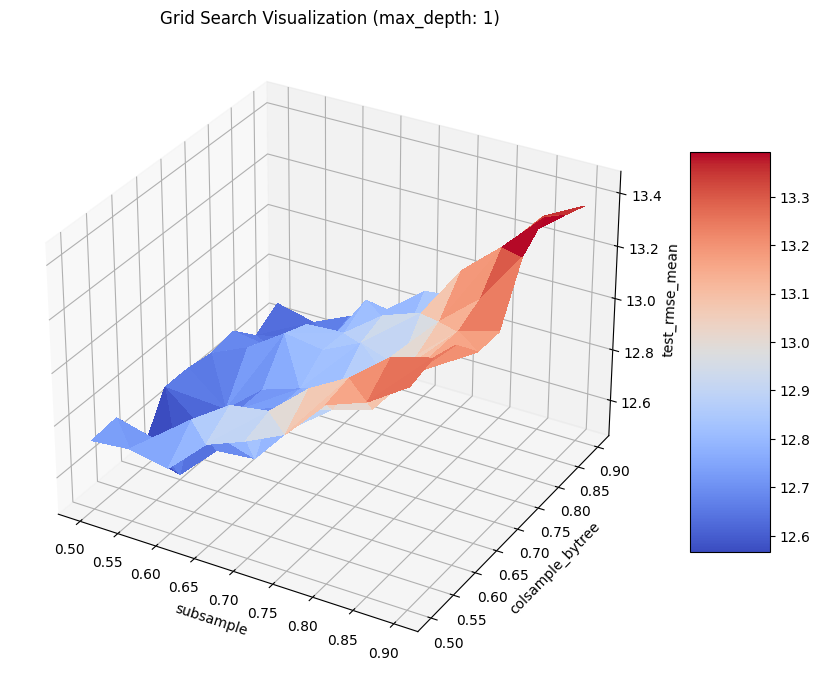
Hyper-parameter Tuning
A hyper-parameter is a parameter whose value is used to control the learning process. By contrast, the values of other parameters (typically node weights) are learned.
GossipCat provides hyper-parameter tuning for XGBoost.
search = gc.lab.GridSearch(df=df,
                           target=target,
                           features=features,
                           regression=True,
                           log_path=f_log)

search.search(range_max_depth=range(1, 5, 1))

search.get_log()

search.visualize(max_depth=1)
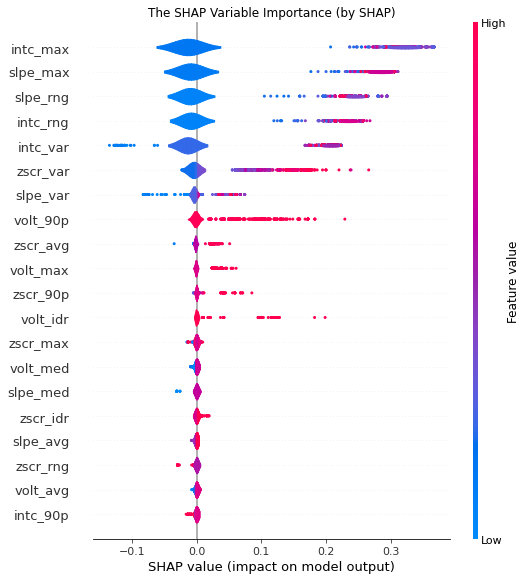
Explanation

Kazimir Malevich Black Square 1915
The Black Box is more like a cliche in the machine learning field appearing in most superficial talks. This is even not necessary when it comes to tree-based models. GossipCat provides two ways to explore tree-based models you build:
exp = gc.lab.Explain(model, X, y, target, features)

exp.tree(tree_index=exp.model.best_iteration, class_names=['Normal', 'Abnormal'])

exp.feature_importance()
Model Development
Model development and maintenance is under the MLOps topic, which is a quite new but fast-growing area in the data science field. As it is out of the scope of GossipCat, we will not cover much content here. For more information, you may refer to Ewen’s other package BatCat.
Git
Git is a version control system designed to track changes in a source code over time.
When many people work on the same project without a version control system it’s total chaos. Resolving the eventual conflicts becomes impossible as one has kept track of their changes and it becomes very hard to merge them into a single central truth. Git and higher-level services built on top of it (like Github) offer tools to overcome this problem.
Docker
Docker is a software container platform that provides an isolated container for us to have everything we need for our experiments to run.
Essentially, it is a light-weight Virtual Machine (VM) built from a script that can be version controlled; so we can now version control our data science environment! Developers use Docker when collaborating on code with coworkers and they also use it to build agile software delivery pipelines to ship new features faster.